Home › All dashboards › Global Unemployment
Global Unemployment — Power BI dashboard
Unemployment Power BI dashboard: unemployment as a share of the labour force, by country.
⚡ Built with GPT-5.6 Sol
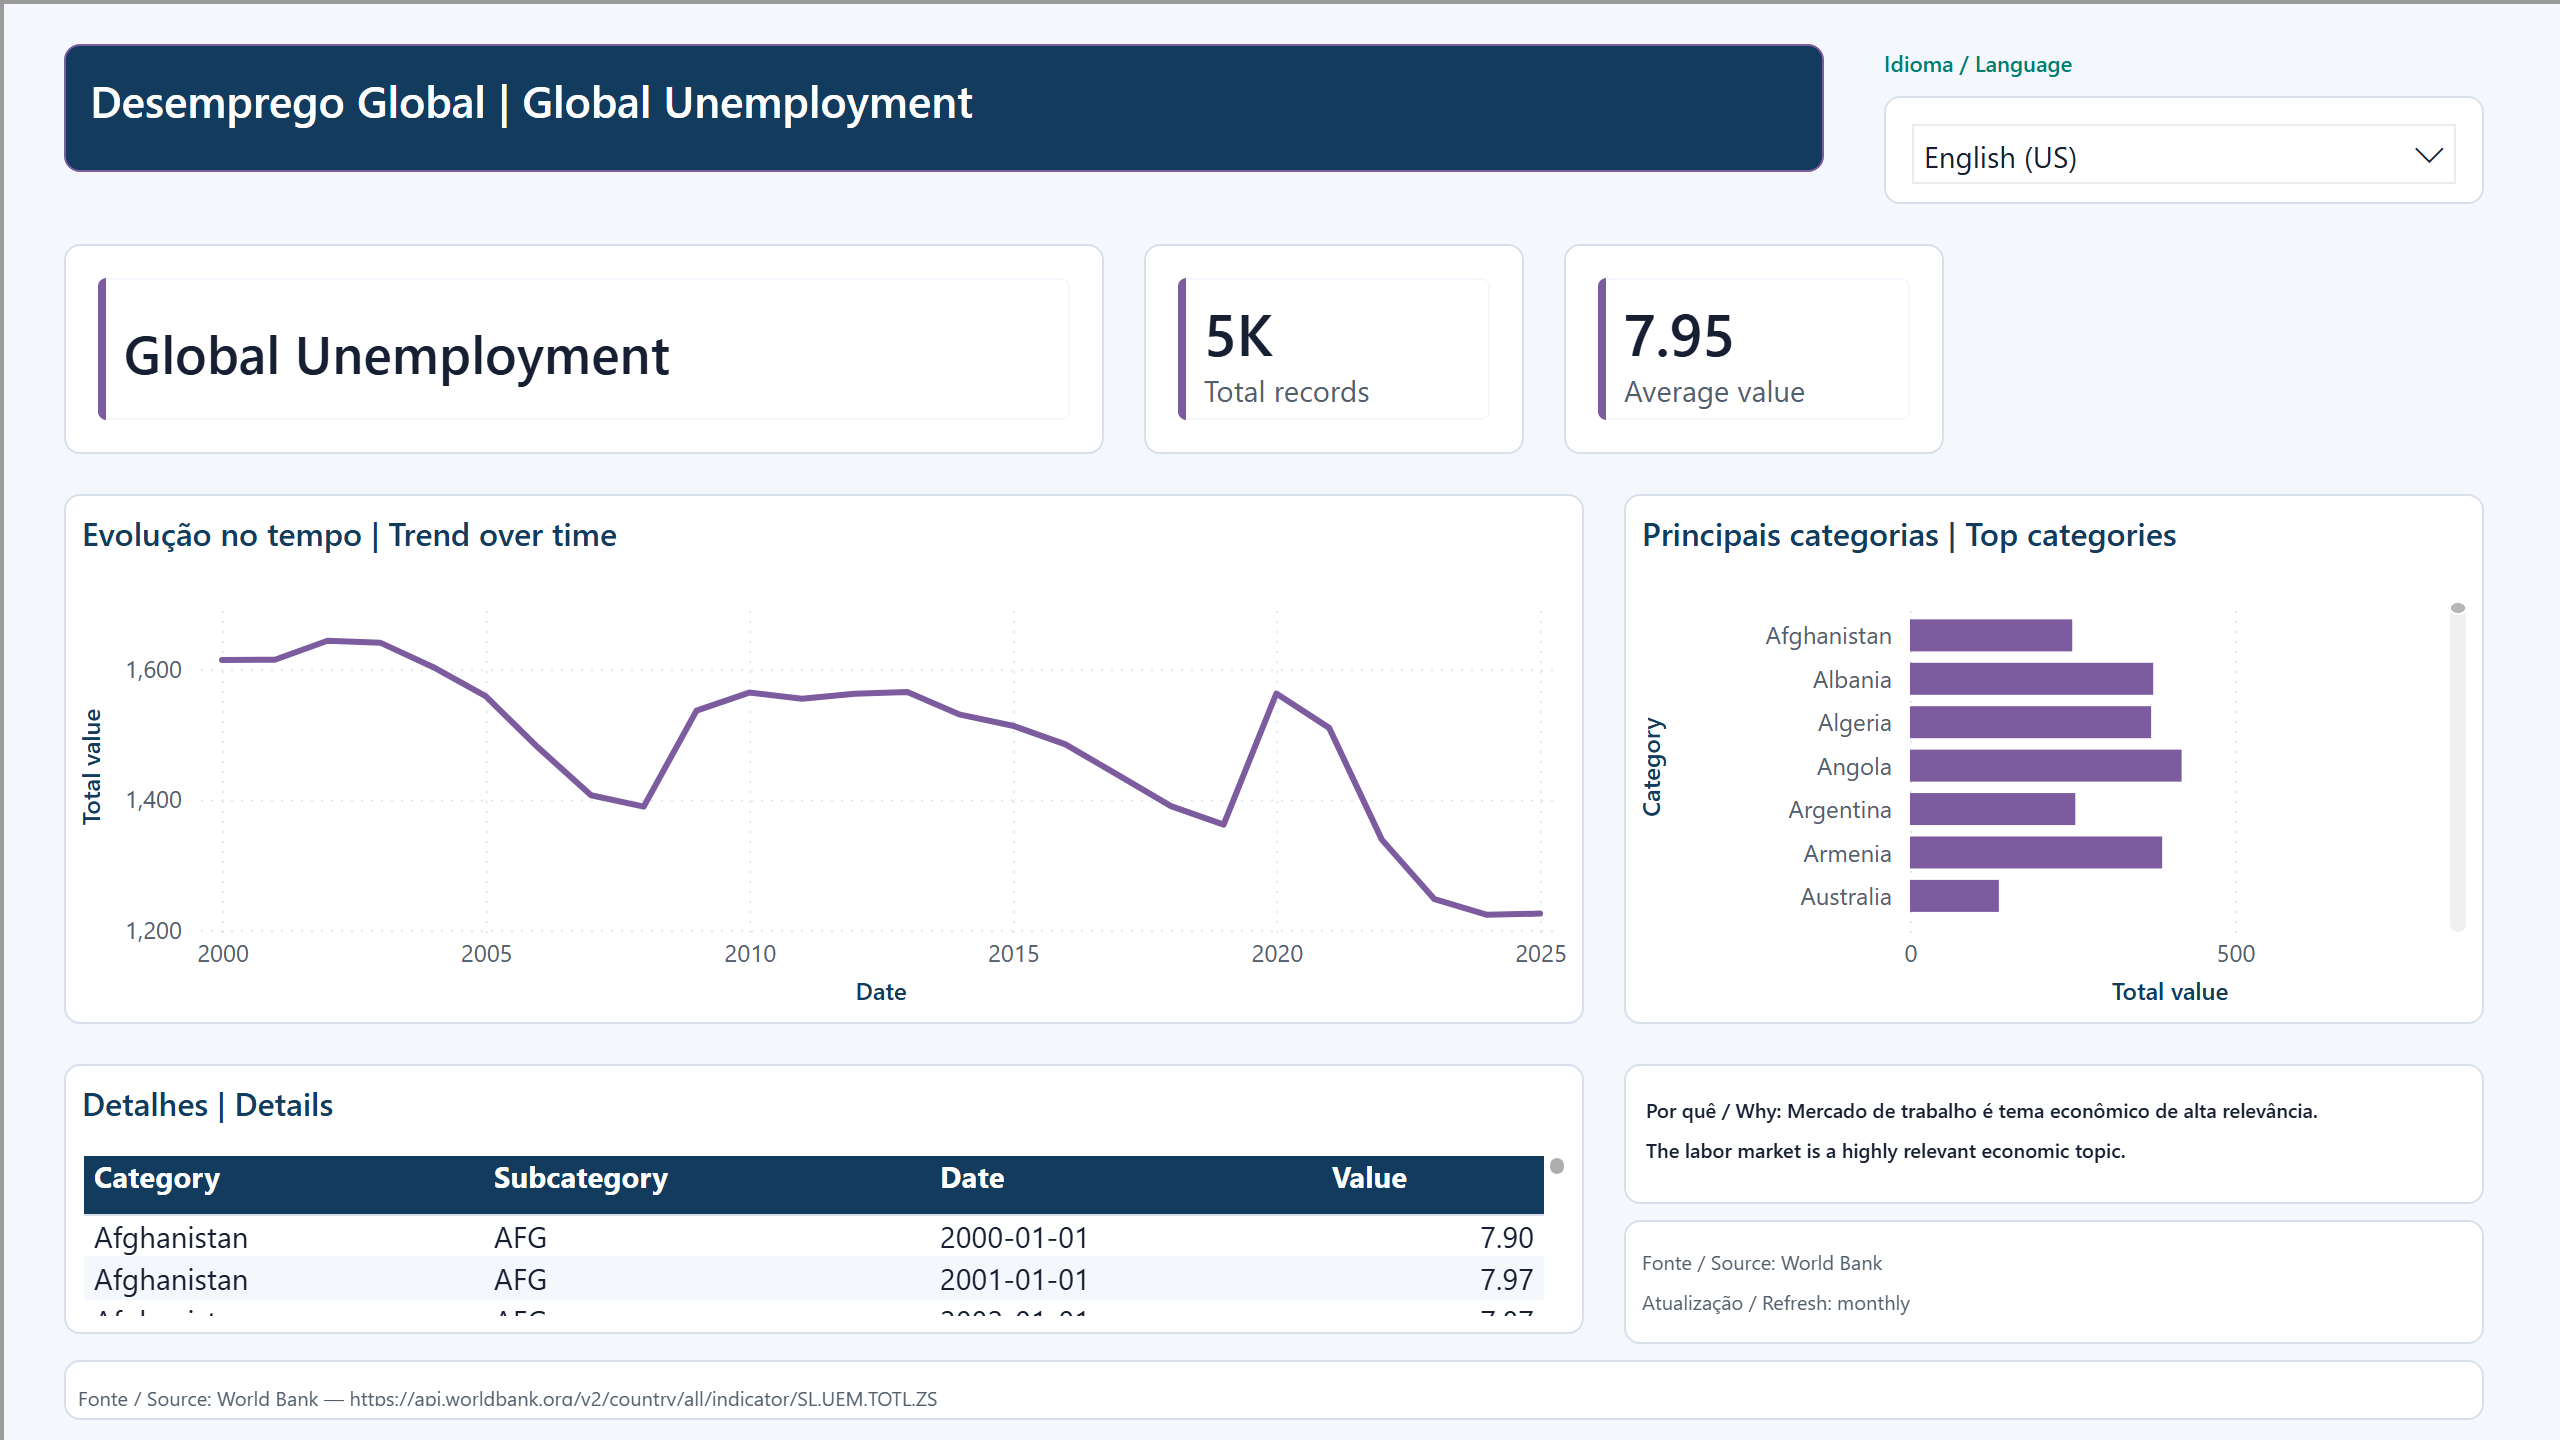
Shows unemployment as a share of the labour force by country (World Bank SL.UEM.TOTL.ZS). The historical series exposes the pattern that matters: how fast each labour market absorbs a shock and returns to its previous level.
A reference for hiring plans, salary studies and business cycle reading. Worth remembering that the unemployment definition depends on who is actively looking for work — which explains part of the gap between countries.
What's inside
- KPI cards with total records, average value and latest date.
- Trend-over-time chart and a ranking of the top categories.
- Detail table with category, subcategory, date and value.
- Language selector inside the report itself: English and Portuguese.
Interactive report
Use the language selector inside the report to switch between English and Portuguese.
Turn your phone sideways to see the report larger.
Loading the report…
Want one of these on your own data?
These dashboards run on public sources. The same process runs on your database — you share only the data structure, never the data itself.