Home › All dashboards › Global Inflation
Global Inflation — Power BI dashboard
Global inflation Power BI dashboard: annual consumer price index change by country, sourced from the World Bank.
⚡ Built with GPT-5.6 Sol
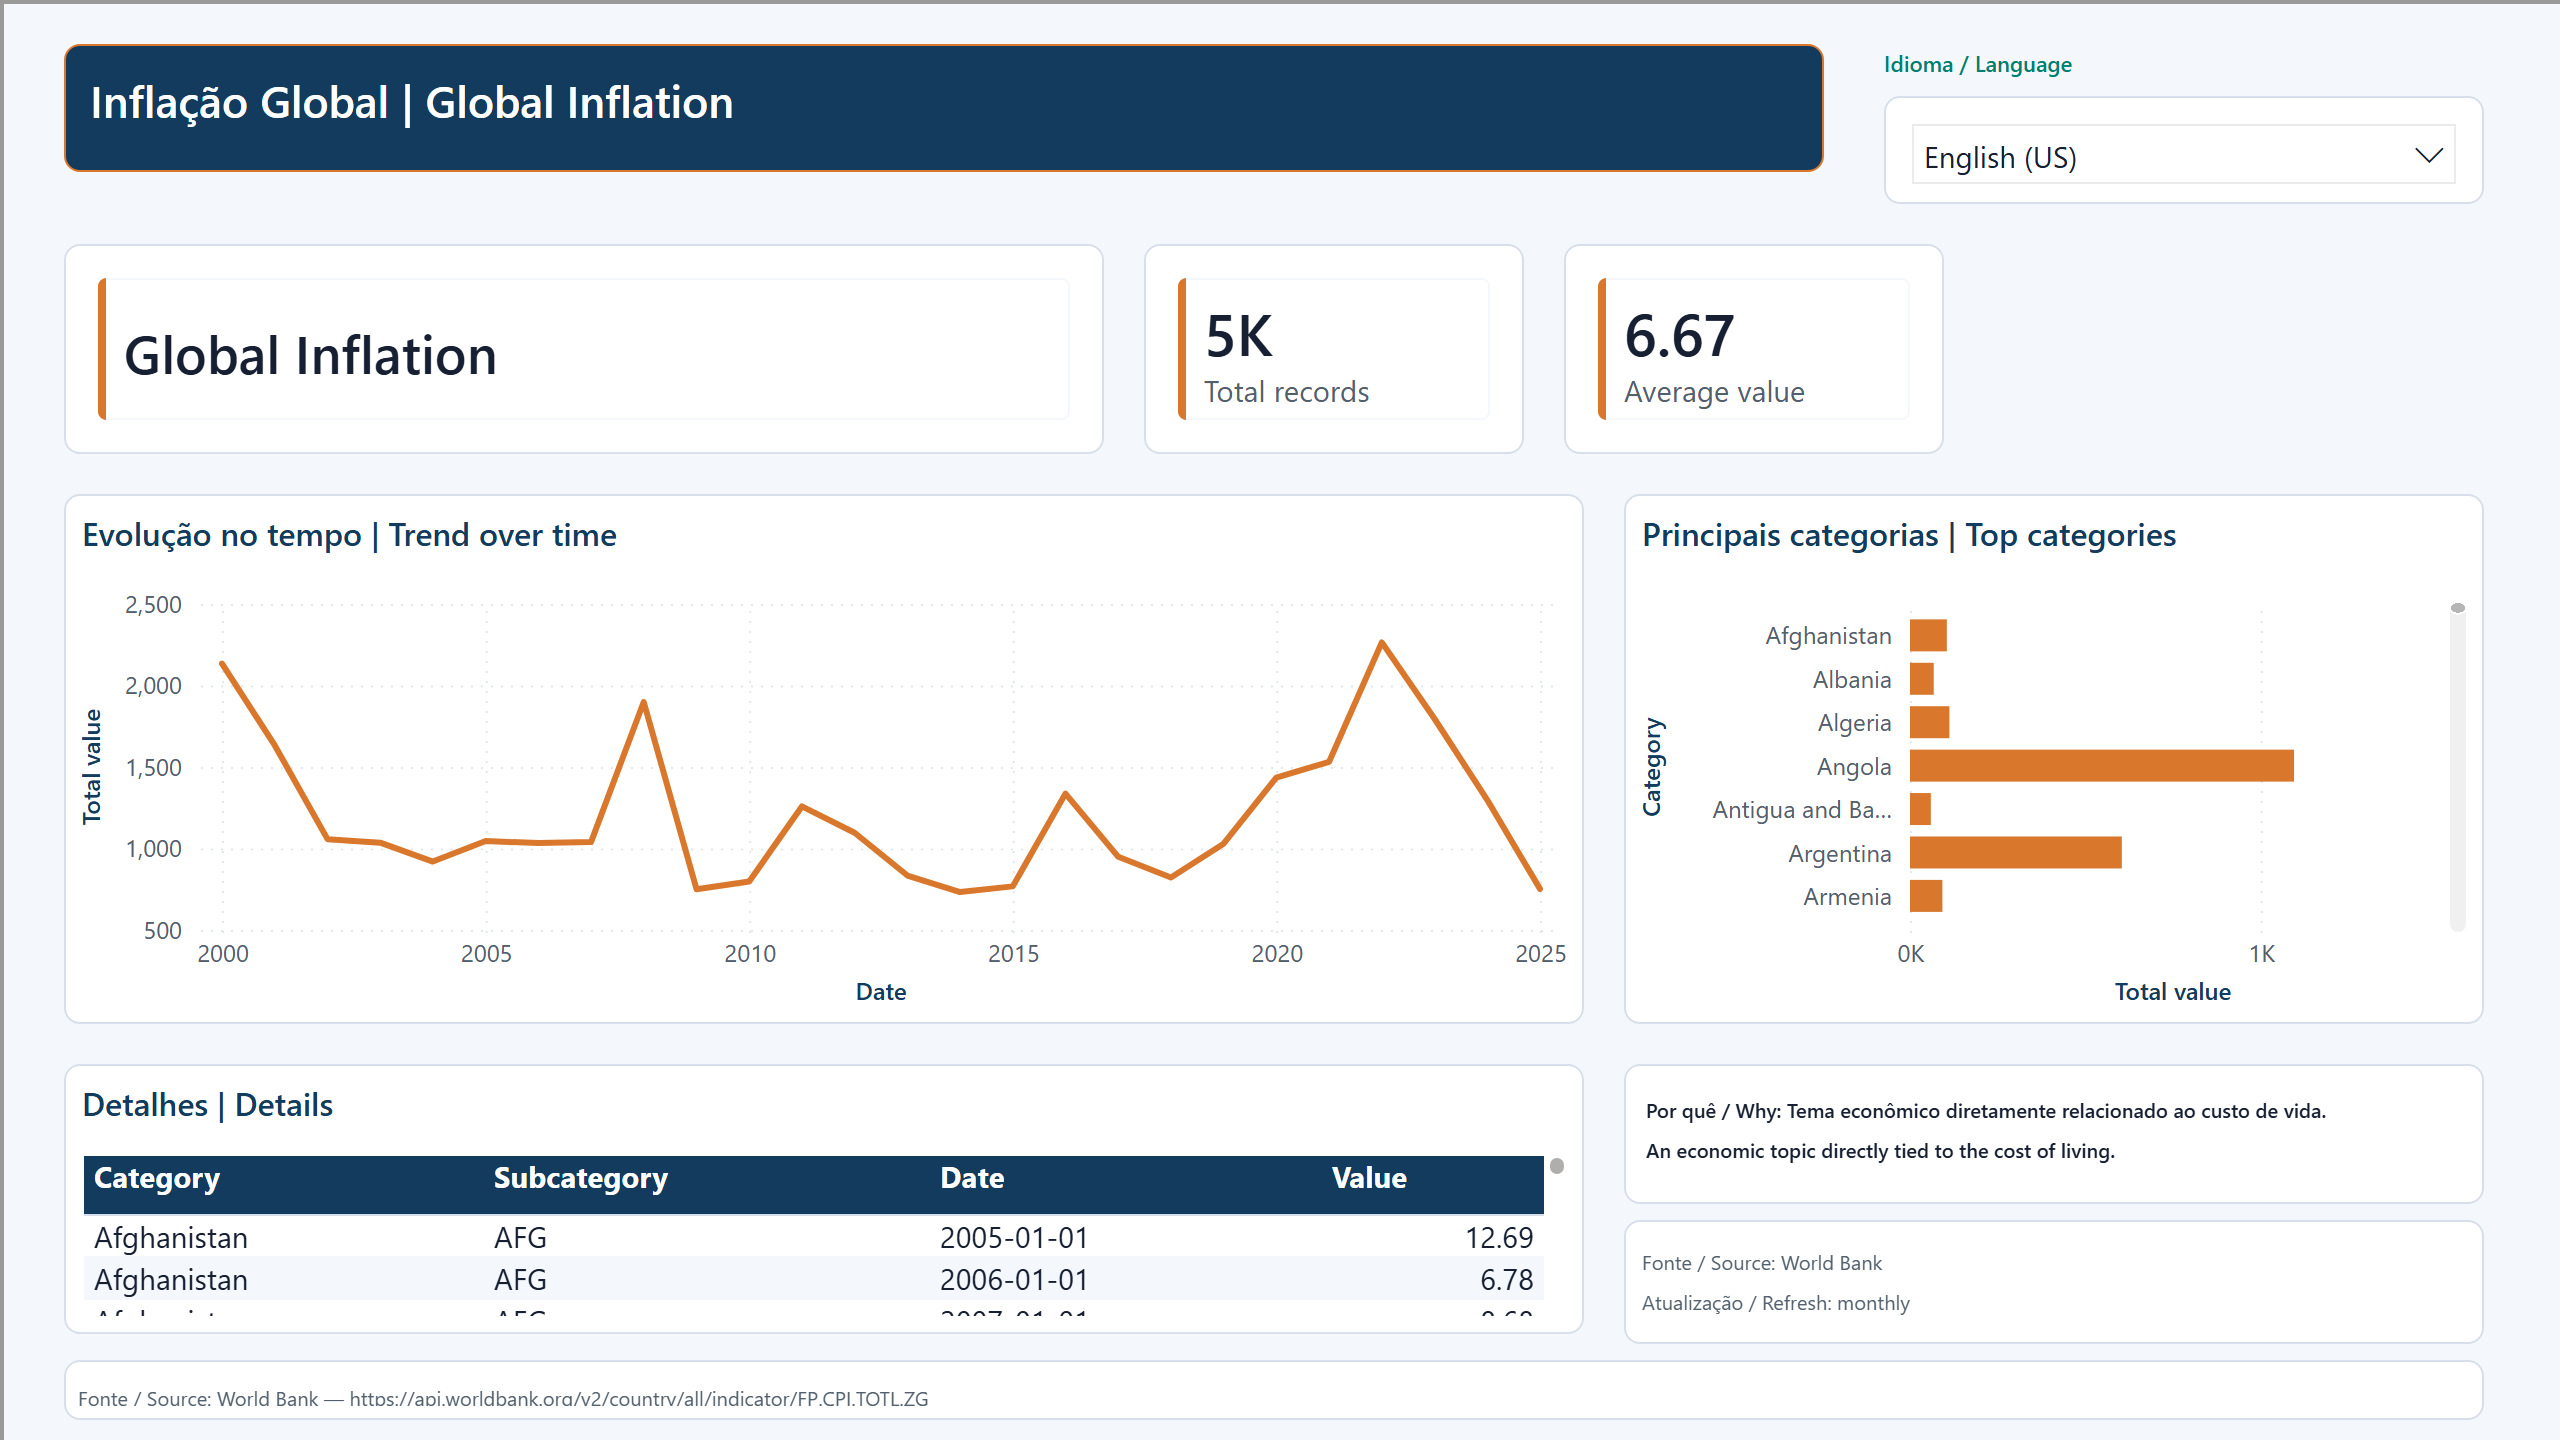
Shows the annual change in the consumer price index by country (World Bank FP.CPI.TOTL.ZG). The historical series puts hyperinflation episodes, stable periods and the recent inflationary shock on the same chart, so each country's experience can be compared.
It is the backdrop for repricing decisions, indexed contracts and cost forecasting. For companies operating in more than one country, the side-by-side view shows where passing on price increases is unavoidable and where it is a choice.
What's inside
- KPI cards with total records, average value and latest date.
- Trend-over-time chart and a ranking of the top categories.
- Detail table with category, subcategory, date and value.
- Language selector inside the report itself: English and Portuguese.
Interactive report
Use the language selector inside the report to switch between English and Portuguese.
Loading the report…
Take this dashboard
You get the `.pbix` with the data already inside — it opens in Power BI Desktop and works offline, with nothing to configure — plus the editable PBIP project and the source documentation.
Only if you want the invoice in your name. The purchase works the same without it.
Use, modify and use commercially, including in client work. Reselling the file itself is not included.
Want one of these on your own data?
These dashboards run on public sources. The same process runs on your database — you share only the data structure, never the data itself.